
Updated
The trade journal
A P&L calendar, day summaries, executions and career stats for every session you finish.
Open Trades in the top bar.
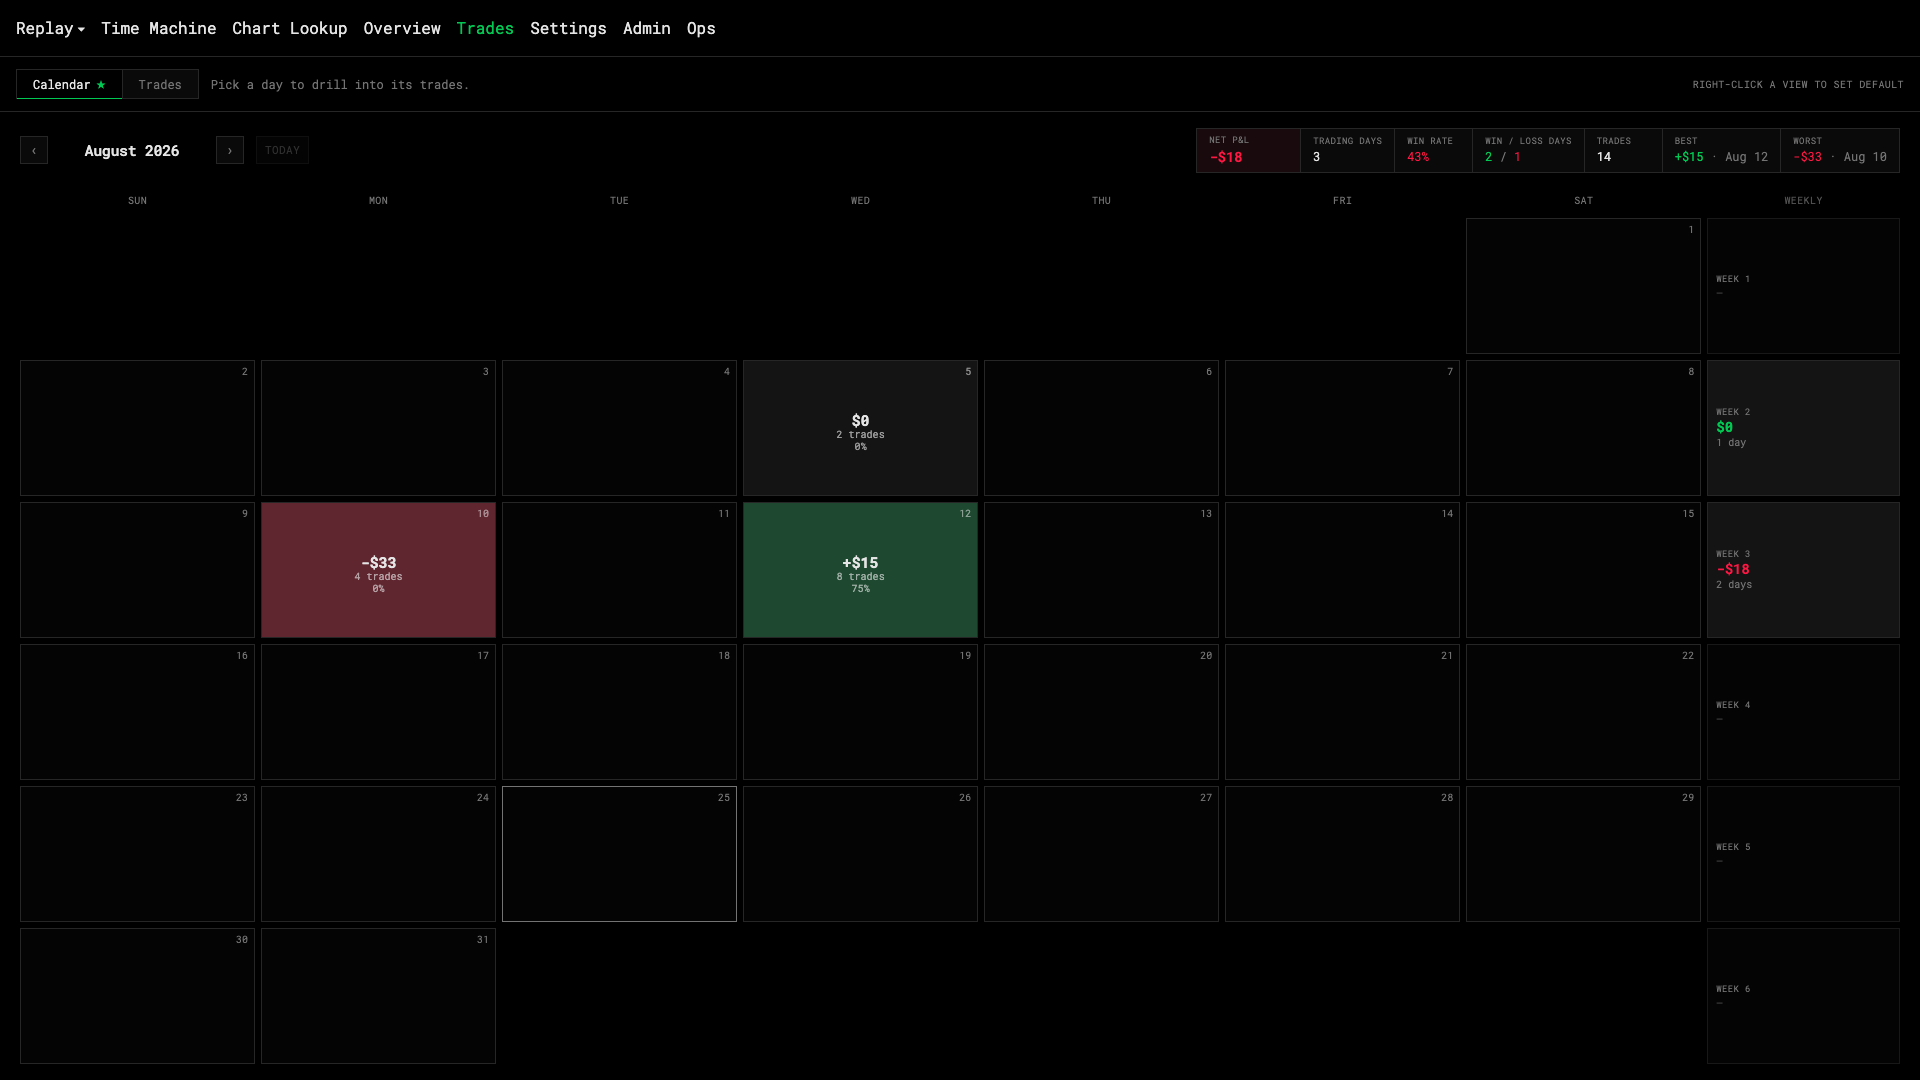
Calendar
Each day is shaded by P&L — green profit, red loss, grey flat. Click a day to open its sessions. The month is in the URL (#2026-08), so a view is linkable.
A session
- Executions chart on the left, executions table on the right. Click a marker to scroll to its row; hover a row to light up its marker.
- Switch the chart timeframe to re-draw at a different resolution.
- Notes — free text per session, saved as you type.
Stats
The Stats rail shows career totals: session count, total P&L, average win rate, total trades, worst drawdown. They’re computed server-side from the ledger and can’t be edited from the app — only wiped.